1
Visualise Your PMA in Real-time
Ri▸focus®PMA Mapping
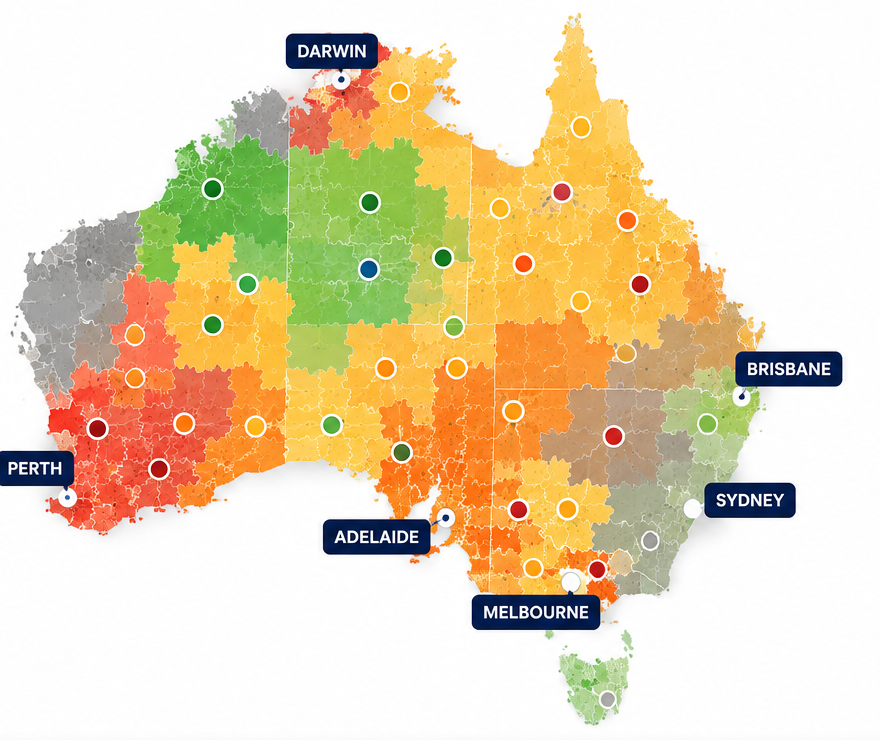
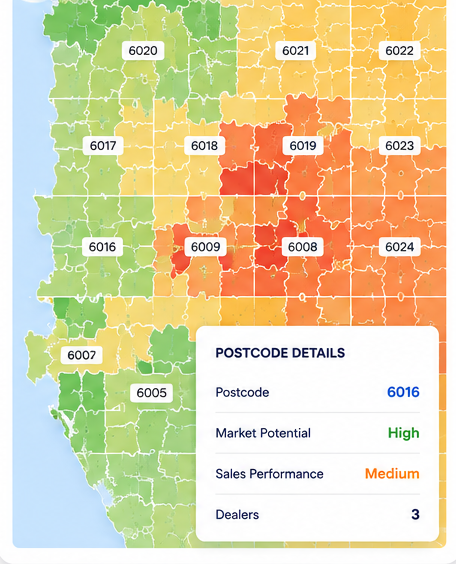
- Interactive PMA mapping with real-time performance visibility
- Dynamic overlays show opportunity, performance and potential
- Understand market coverage and identify gaps with clarity
PMA MAPPING
Most OEMs can define PMA priorities.
Very few can consistently align field teams, dealers, and execution against them.
Visibility without execution
doesn’t improve performance.
Ri-focus PMA Mapping brings your market, performance and opportunity data together in one dynamic view—
so the right people take the right action.
PMA Coverage Analysis
Identify coverage gaps and white space.
Dealer Territory Alignment
Review alignment and overlap across the network.
Market Opportunity Overlay
Visualise potential based on market data.
Postcode-Level Visibility
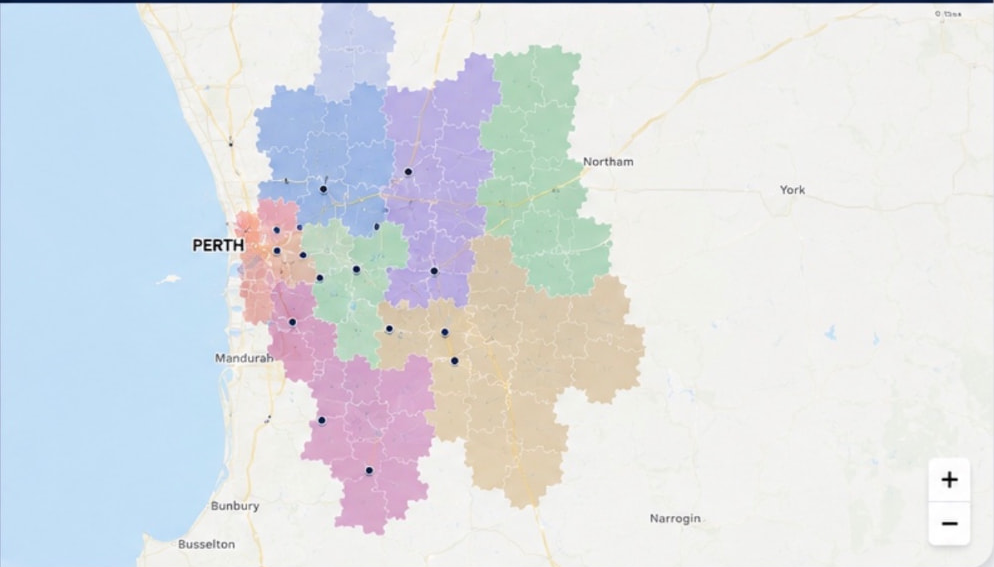
Drill down to postcodes for granular insights.
Performance vs Potential
Compare dealer performance to market potential.
Franchise Boundary Review
Support fair territory distribution and franchise planning.
From insight to action. From strategy to results.
Ri-focus PMA Mapping connects your priorities to real-world execution.
PMA MAPPING
For automotive OEMs, understanding how Primary Market Areas perform isn’t just helpful — it’s mission-critical.
Static spreadsheets and broad regional reporting no longer provide the clarity needed to manage modern dealer networks.
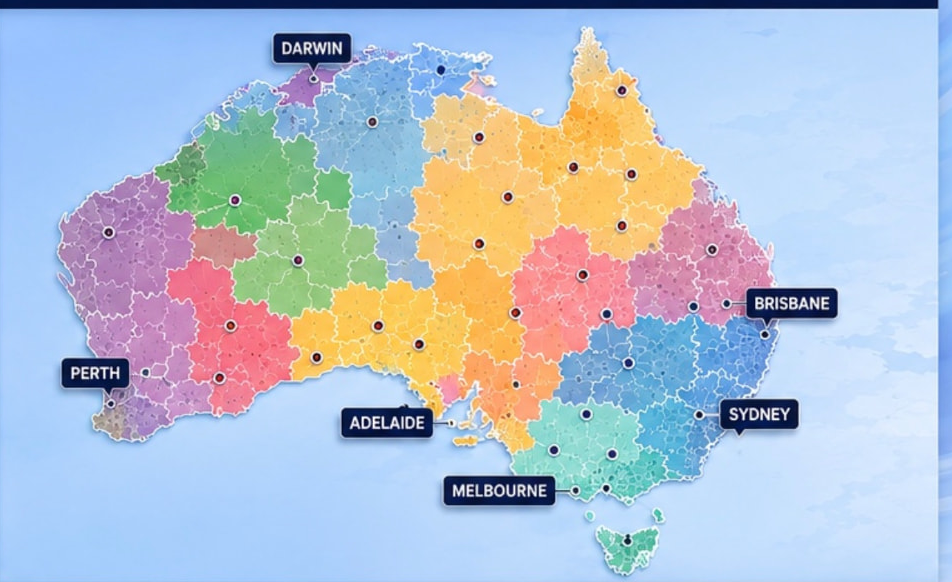
A Primary Market Area (PMA) defines the geographic territory allocated to each dealership. But while PMAs are clearly defined, performance within them is rarely evenly distributed. Op2ma’s PMA Mapping tool overlays your brand’s PMAs across Australia, with colour intensity reflecting sales volume or market share performance.
No guesswork. No assumptions.
Just clear, actionable insight.
PMA Mapping transforms complex sales and share data into a powerful, interactive visual experience—
giving OEMs and dealers one shared view of opportunity.
Optimise Dealer Network Performance
Identify which PMAs are overperforming, underperforming, or under-served. Support dealers with targeted strategies rather than blanket national campaigns.
Improve Market Share with Precision
Drill down to postcode level to understand exactly where your brand is winning and where it isn’t. Align marketing spend and sales initiatives accordingly.
Strengthen OEM–Dealer Collaboration
A shared visual reference point removes ambiguity around territories and enables data-backed discussions about opportunity, performance and accountability.
Align Inventory & Model Strategy
See which segments or models are resonating in specific areas. Allocate stock and marketing support based on real demand patterns — not assumptions.
Why OEMs use PMA Mapping.
Targeted strategies, precise market share growth and stronger dealer collaboration.
PMA MAPPING
Upload what you already have.
PMA Mapping turns it into interactive, postcode-level intelligence.
Ready to see your market differently?
Book a demo and unlock hidden opportunity inside your existing PMAs.
Interactive PMA mapping gives you complete visibility of your dealer network, market potential and performance—down to postcode level.
See the full picture. Spot the gaps. Act with confidence.
An OEM implemented PMA Mapping to improve the quality of discussions with their dealer network. The result?
Both the OEM and its dealers found the tool intuitive, practical and immediately valuable. It eliminated uncertainty and replaced it with clarity.
From geographic data to measurable sales growth.
Book a demo of Op2ma’s PMA Mapping tool today.
PMA MAPPING
Ri-focus PMA Mapping turns performance and opportunity data into aligned priorities, actionable plans and measurable results across your network.
One View
Across the Entire Network
Targeted Focus
Where Opportunity Is Greatest
Aligned Action
Everyone Working From the Same Priorities
Measurable Impact
Track Progress. Improve Results.
NETWORK DATA
Bring together the data that matters most.
VISUALISE
Transform complex data into clear, actionable PMA intelligence.
ALIGN
Align priorities and resources to drive the right actions.
IMPROVE
Execute, track and improve with confidence.
WHAT THIS DELIVERS
For OEMs
For Field Teams
Integrated Data
Connects with your existing systems
Secure & Scalable
Enterprise-grade security and global scalability
Configurable
Tailored to your PMA model and processes
Collaborative
Built for OEMs, field teams and dealers to work together
Accessible Anywhere
Web & mobile access in real time
PMA MAPPING
Ri-focus PMA Mapping gives you the tools to visualise, analyse and manage Prime Market Areas with precision — so you can align your network and drive performance.
Live Visibility
See your network as it performs.
Smarter Analysis
Layer data to reveal what matters.
Precision Planning
Define and refine with confidence.
Stronger Alignment
Align teams, dealers and territories.
Measurable Impact
Track what drives results.
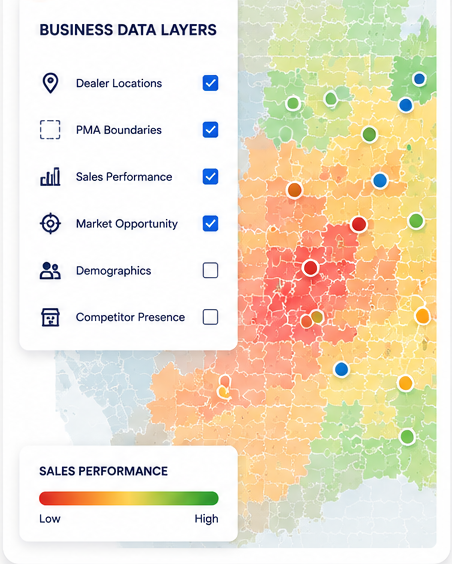
Turn PMA insight into coordinated network execution.
Align priorities. Drive action. Improve performance.